One of the two corrections in a five-wave impulse phase of a market will likely be a complex correction. You may be wondering whether it is hard to trade if this complex pattern happens to become an irregular correction. We will discuss this issue in detail with the help of an example from the Natural Gas Futures contract that trades in India’s MCX Exchange.
Why is trading an irregular correction hard?
Remember that irregular corrections are, by definition, complex corrections! During a complex correction, there is a tendency for asset prices to move in unexpected directions. To make matters worse, these change in course will also happen when you least expect it!
For example, once a wave 3 low has been posted, you might be expecting a wave 4 correction to reach the 38.2% retracement of wave 3. But the price could stall ahead of that level and come back to break the wave 3 bottom. You will be thinking that perhaps the main trend has resumed, that is we are now in wave 5. But suddenly, after moving beyond the wave 3 end point, prices start reversing again. And this time, when you feel that all five waves are finished, and a new trend is beginning, the price makes a turn again and goes all the way back to make a new high or low!
Traders seek an orderly movement so they could plan their action. But an irregular correction will leave them bewildered! Unless of course you learn how to anticipate the end of wave C of an irregular correction!
How can we anticipate the occurrence of an irregular correction?
If we are in a wave 4 position, look at wave 2 to see of that was a simple correction. If that was true, then wave 4 could develop into a complex correction. However, you will never know in advance what type of complexity you are going to witness. That means you cannot anticipate the occurrence of an irregular correction with certainty.
Are there some usual places where irregular corrections are seen?
Irregular corrections are usually seen at the end on of an extended wave 5 because of a phenomenon known as double retracement that is seen at the end of an extended fifth wave. But that does not mean we will not get an irregular correction at the end of a normal wave 5. It is just that traders should be on the lookout for an irregular wave B move after an extended wave 5 is corrected inadequately by the first counter-trend move.
I have also seen irregular corrections happening in a fast-paced market, such as in the middle of an extending wave 3 as a minor correction.
Can we discuss irregular corrections with an example?
Let us consider the Natural Gas Futures contract that trades in MCX in India. This chart serves as a good example of an irregular correction, and at what stage it becomes hard to trade.
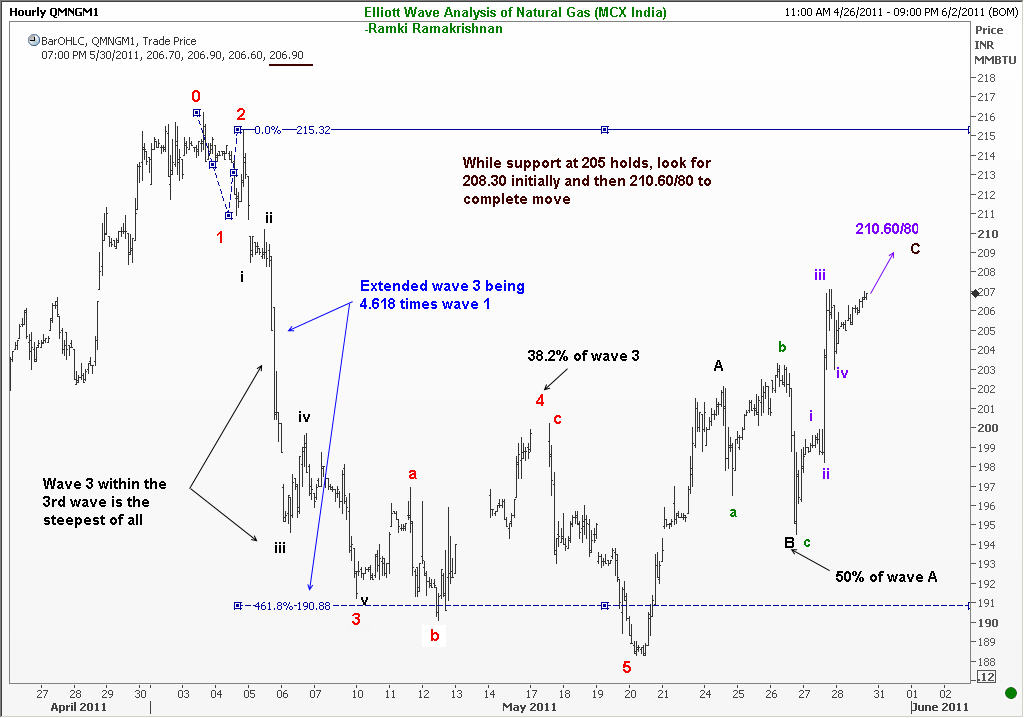
What I see in this chart is fascinating. There were so many opportunities to trade the Natural Gas Futures profitably on the MCX in India! So, what do the Waves tell us? First, we can see a clear five wave down move on the left of the chart. There was an extended 3rd of the 3rd wave, a move that covered 4.618 times the distance of the first wave.
Next, you would have prepared yourself for a complex correction because the 2nd wave was simple. Remember the principle of alternation. This guideline tells us that the two corrections in a five-wave pattern will have different forms.
For example, if wave 2 was brief, wave 4 will be time-consuming. If wave 2 was shallow, wave 4 will be deep. And, as in the case of the Natural Gas contract that we are analyzing, since wave 2 was simple, we will expect wave 4 to be complex. Sure enough, you got an irregular ‘B’ wave.
Where exactly does it become hard to trade the irregular correction?
The trouble with irregular corrections is we won’t know beforehand that the complex correction is going to take this shape. That is what makes it hard to trade in its early stages. However, once you get the irregular ‘B’ wave, and the price starts reversing again, you will be able to anticipate where the wave C of the irregular correction is likely to end.
In the above example of an irregular correction that happened in wave 4 position, the C wave ended nicely at the 38.2% retracement level of the 3rd. You could have anticipated where it will end using the techniques that I taught you in my Elliott Wave book “Five Waves to Financial Freedom“. The final 5th wave also finished at a technical level (50% of the distance from 0-3).
You would have gone long the Natural Gas futures contract near the end of the 5th wave. There was a bit of choppy correction that ensued, because the B wave also was an irregular correction. But hey-presto, it finished at the 50% retracement level. Anyone who was patient could have loaded up nicely near there (waiting to add at the 61.8% levels, but which never showed up!).
Then we embarked on the “C” wave, which I think has just finished its own 4th wave, and we are in the fifth wave of this move. So, it is rather late in the day to consider buying now. Rather one will watch to see what happens near the 210.60/80 and sell there if the momentum fades.
Conclusion.
It is generally hard to trade an irregular correction primarily because we are unable to anticipate its occurrence. Like in any complex correction, the movements within an irregular correction can seem erratic. However, once you know that an irregular wave B end has been posted, you can plan your trades with a bit more ease. As illustrated above with a Natural Gas Futures chart, there are profitable opportunities even as the irregular correction unfolds.