What Is the Outlook for Crude Oil
15 August 2011
You have come to this site because you not only wish to see what the outlook for Crude Oil is in the near term. But more importantly, you would like to know how I arrived at my conclusions. Once you learn my approach, you will be able to replicate it by doing your own Elliott Wave analysis. This article is linked from my Elliott Wave book "Five Waves to Financial Freedom." | |
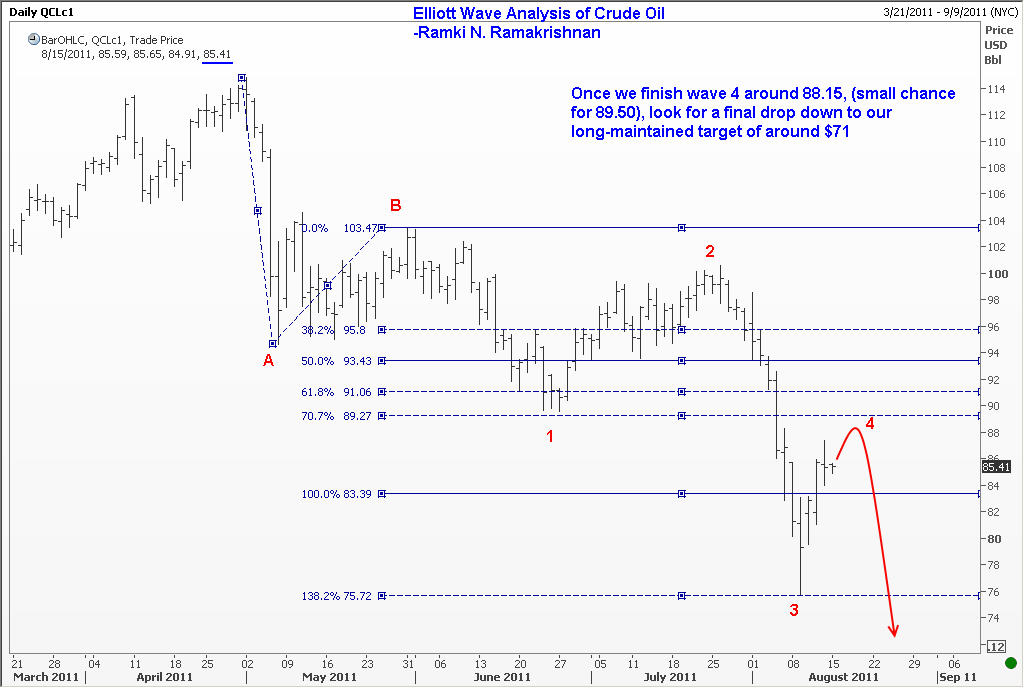
The outlook for Crude Oil in the near term is for a failure between $88.10 and $89.50, and the come down once again. Hopefully, this time we will reach the target of $71 levels. Stops should be placed on two closes above $89.50. Note that this post is dated August 15, 2011 but the lessons are timeless. | |
You will remember from my prior blog posts that we have been bearish on this front from the time Crude Oil was trading around $110. At that time, some leading investment banks were calling it to reach $150! | |
So, how did I arrive at the latest conclusion that Crude oil is likely to fail between $88.10 and $89.50, and after that come down once again? Read on. | |
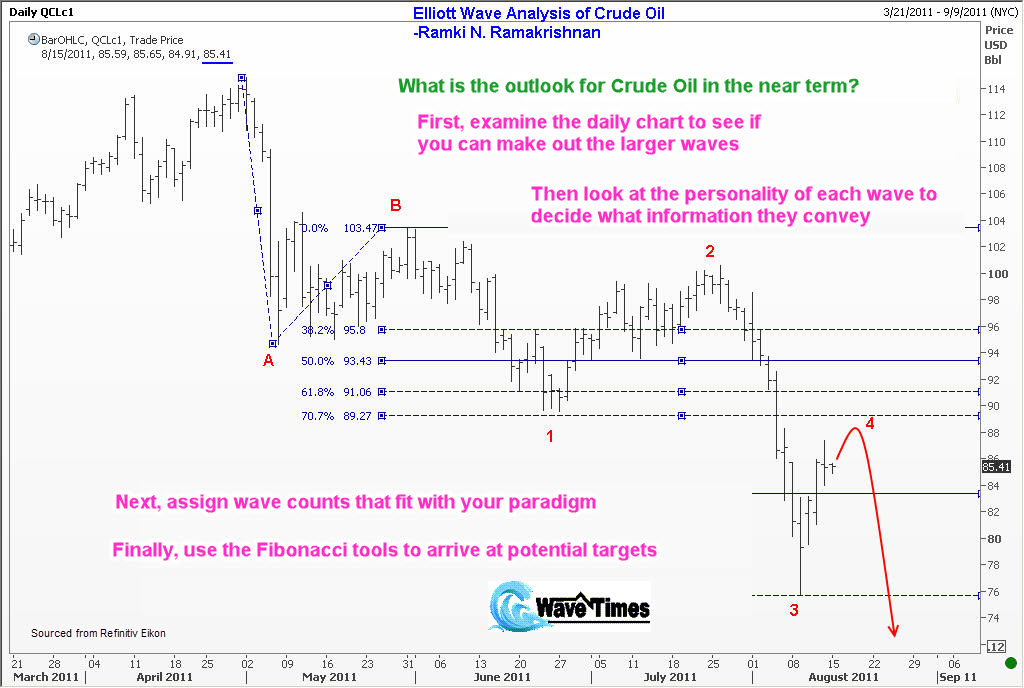
First, examine the daily chart. Can you make out the larger waves? | |
The very first thing you should do when analyzing a chart is to make sure you have the daily chart. This is because the wave patterns will be clearer and more defined in daily charts than in lower time frames such as the hourly charts. Then, look carefully to see if you can make out the larger waves. These can be found just by looking at the chart and without using any measurements. The turning points of Crude Oil can be seen clearly in the chart below. Once you have an idea, you should assign some tentative labels to these waves. | |
| |
You can see from the daily chart of Crude Oil above that I have formed a paradigm to determine what the outlook is. I have tentatively decided that we are in a three-step down move which I will label as Wave A, Wave B and Wave C. In fact, I have already identified where to place wave A and Wave B in the chart. We will now look at the next step in our investigation. | |
What information does the personality of the waves convey? | |
The most useful information is gleaned by looking at the wave that has the steepest decline. That is generally the personality of a third wave. | |
You will remember from my book "Five Waves to Financial Freedom" that all "C" waves will be made up of 5 sub waves. Accordingly, I have assigned the wave 3 label to that part of the chart with the quickest down move. It is then easy to reverse-engineer the other waves of Wave C and assign wave counts to lower degree waves. In this process, you can validate the third wave target by using the Fibonacci Projection measurement technique. | |
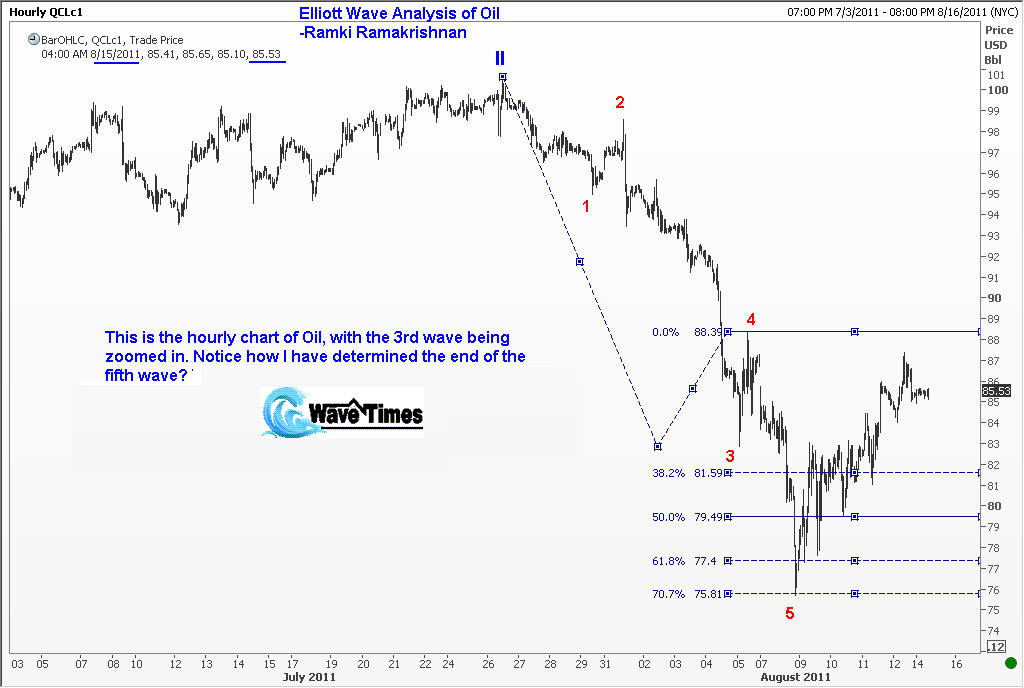
As you know from my articles on anticipating the target for fifth wave, we can validate our identification of the end of wave 3 by looking at the five sub waves inside it. That sub wave 5 target can be arrived at using the technique that I have taught in my signature online program "How to Profit from Elliott Waves." | |
Basically, we measure the distance from point zero to point 3 and compute some standard Fibonacci ratios of this measurement. We then subtract these from the sub wave 4 top to arrive at possible ending points for sub wave 5. You will see from the hourly chart of Crude Oil below that sub wave 5 of wave 3 ended precisely at 70.7% of the measure of the distance from o to 3. Thus, we have confirmed to ourselves that our placement of wave 3 ending point there is indeed likely to be correct. | |
| |
Next, assign wave counts that fit your paradigm | |
We will now assign specific wave counts to the different moves that we are seeing in the time frame being considered. Thus, we will assign the label of Wave III to the bottom of the five-wave move that commenced from the top of wave II. | |
Finally, use the Fibonacci tools to arrive at potential targets | |
Once we determine where to place the end of wave III, we decide on possible targets for wave IV. Accordingly, the outlook for Crude Oil in the near term is a failure between 88.10 and 89.50, and decline again. Hopefully, this time we will reach the target of 71 levels. Stops should be placed on two closes above 89.80. How did I arrive at this level of 88.10? The 89.50 level is easy enough to see as that is the 50% retracement of wave III. Recall that wave III went down from 103.47 to 75.52. When it comes to real-world trading, there are some subtle points that are not immediately seen. These are taught in my online program on How to Profit from Elliott Waves. | |
| |
Conclusion | |
When trying to determine the outlook for Crude Oil, I recommend that you follow these steps: | |
1. Check out the Daily Chart and see if you can make out the large wave Patterns. This will allow you form a tentative view on where we are in the cycle. |
Want to go further with Crude Oil? the corrections chapters of Five Waves to Financial Freedom, which use commodity examples just like this one walks through it with real trades and real numbers, not textbook theory.