
A quick update on the S&P500 index
3 April 2013
| |
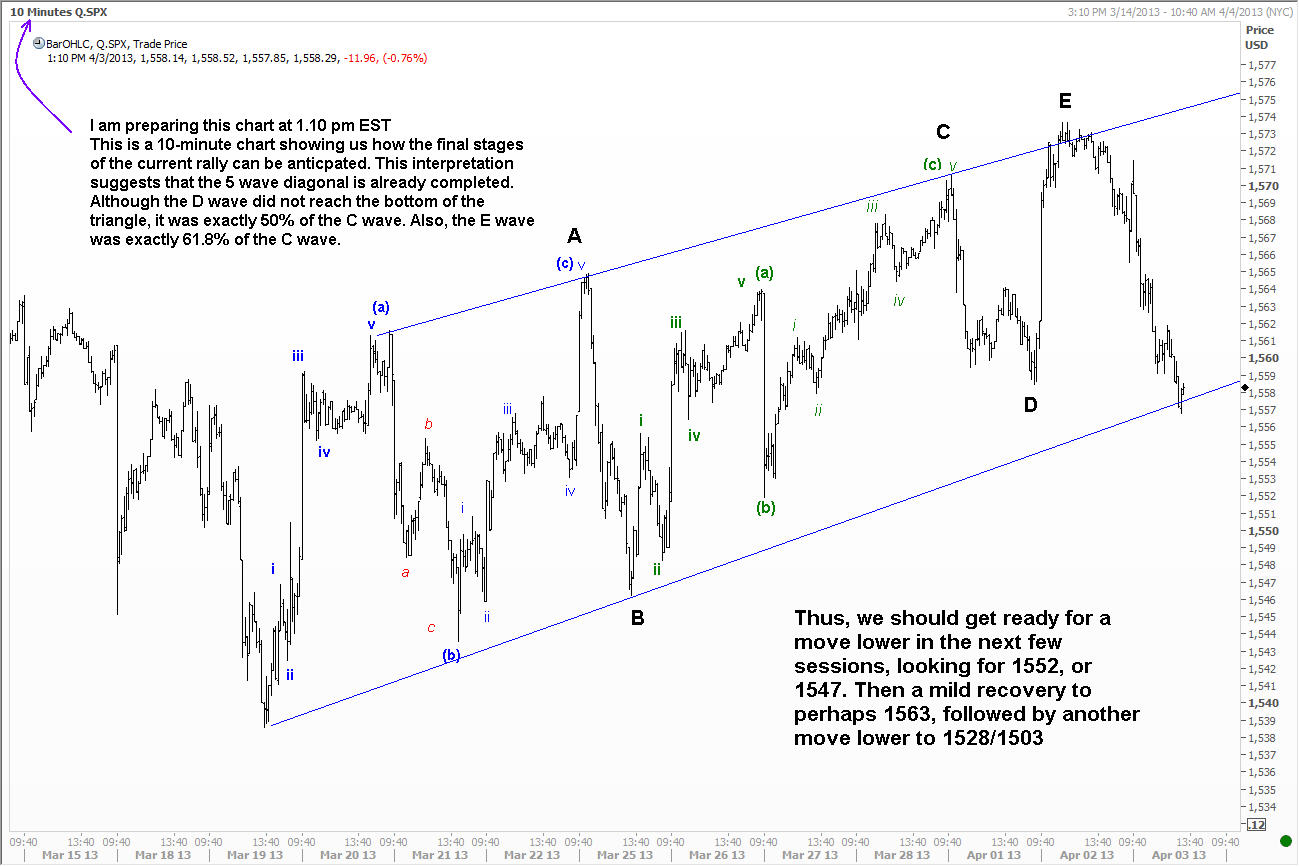
I am posting this around 1.30 pm EST on 3rd April. The S&P500 index is straddling the bottom of a diagonal triangle, and a break seems imminent. What you can learn from the chart below is how the internal waves are all so related to each other, and have followed the Elliott Wave rules. Enjoy. | |
If you'd like to see how I work through the S&P500 in real depth, I cover this in Module 6 (S&P500 Index) and Module 11 (the S&P500 Crash).