
Elliott Wave Analysis of Cairn India
13 March 2011
| |
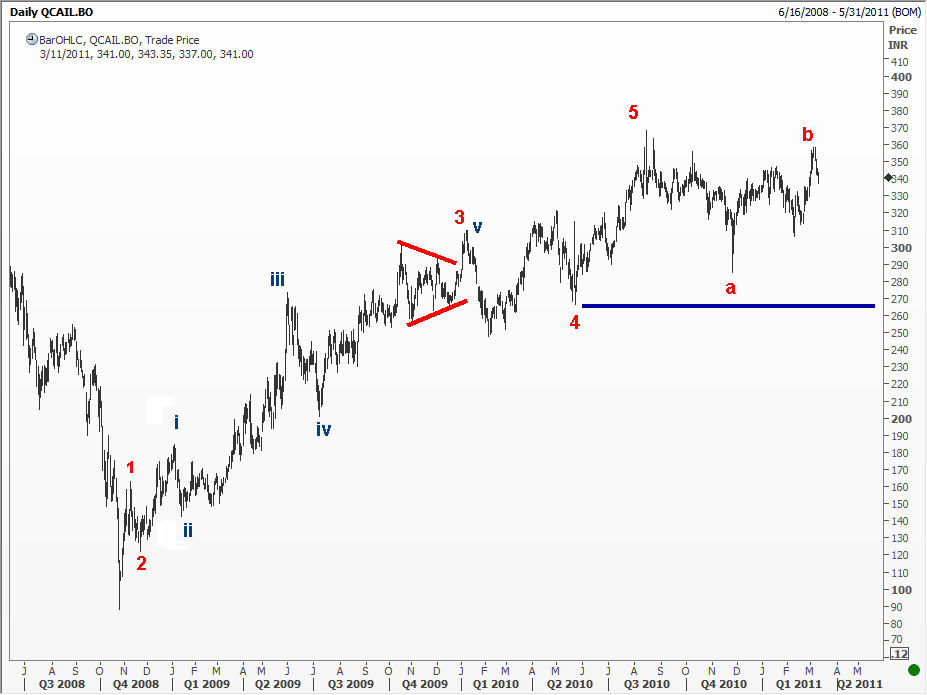
I thought I’d take a quick look at the chart of CAIRN india before shutting down for the upcoming holidays. But I ended up spending a good 30 minutes trying to decipher what was going on. At long last, I have come up with my best version and here is the bottom line. A five wave sequence is probably over, and we are just in the early stages of the C wave of teh correction. Take a look at the chart for the details. | |
Want to go further with Indian stocks? Module 9, Module 10, Module 17 and Module 18 of my course, built around real Indian stock case studies like TCS, BHEL and Bajaj Finance walks through it with real trades and real numbers, not textbook theory.