
Elliott Wave Analysis of Dr. Reddy’s Laboratories Ltd
2 March 2013
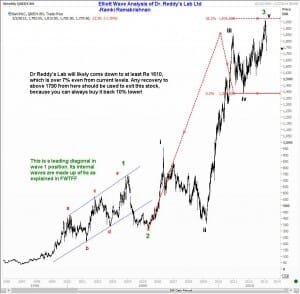
Elliott Wave Analysis is a powerful tool if used properly. For instance, the following Elliott Wave Analysis of Dr. Reddy’s laboratories Ltd as shown in the chart suggests that a major extended third wave has likely finished at the Rs 1968 levels. If you had this stock in your portfolio, and noticed that the 5th wave has a target at 1976, would you have waited for the last 25 or 30 rupees before getting out? Of course not! | |
I am positive that there are countless traders who went long this stock above 1900, and are now hoping it will come back to break even. Whether you are a trader or an investor, you are better off learning some technical analysis. | |
| |
Now what does the chart of Dr Reddy’s Lab tell us? Elliott Wave analysis tells us that a three-wave correction is due, because an extended third wave has been completed. We should look for a minimum correction of 23.6% of the 3rd wave, and that should bring the stock down to around Rs. 1600. That is the minimum target. It could go down a lot more! Suppose you own some of this stock, what should you do? You should consider selling on a recovery to around 1790 and not worry about it till it eventually comes down to around 1610. | |
I teach exactly this kind of Indian stocks setup, step by step, in Module 9, Module 10, Module 17 and Module 18 of my course, built around real Indian stock case studies like TCS, BHEL and Bajaj Finance.