
Elliott Wave Analysis of EOG Resources Inc (NYSE: EOG
17 February 2013
| |
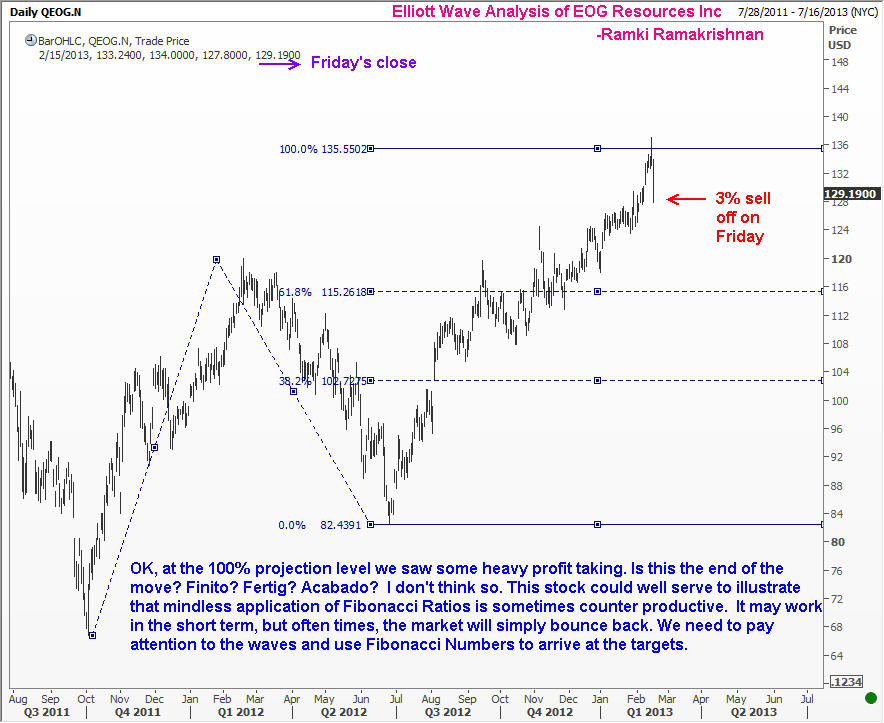
Some people think that Elliott Wave Analysis is largely the ability to compute Fibonacci Ratios. When I saw the attached chart today, I wondered whether this could be a nice example to share with you. Of course, I could be completely wrong, and EOG Resources could plunge to zero tomorrow. On the other hand, I do believe that there is a reasonably good chance for 126.50 to hold and for us to at least recover to 133, if not higher (maybe even to 137). Use this update to learn. Remember that the WaveTimes Blog does not offer trading advice! Enjoy. | |
| |
Want to go further with US stocks? Module 6, Module 11, and several other modules of my course built around real US stock case studies walks through it with real trades and real numbers, not textbook theory.