
Follow up Elliott Wave post on Polaris
20 March 2015
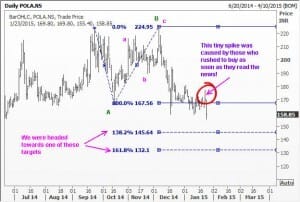
It is two months since I posted something, and I looked up the Polaris chart. Well, we certainly have reason to smile. Here are two charts. The first chart was posted here on 23 Jan and the second chart shows that Polaris did indeed come down quite close to the lower target mentioned, a move of over 16% from the time we discussed this stock. Enjoy. | |
| |
And now we see that Elliott Wave analysis of Polaris did not let us down. | |
This is the kind of Indian markets setup I break down in detail in Module 9, Module 10, Module 17 and Module 18 of my course, built around real Indian stock case studies.