
FOMC triggers spurt in Gold price
26 January 2012
| |
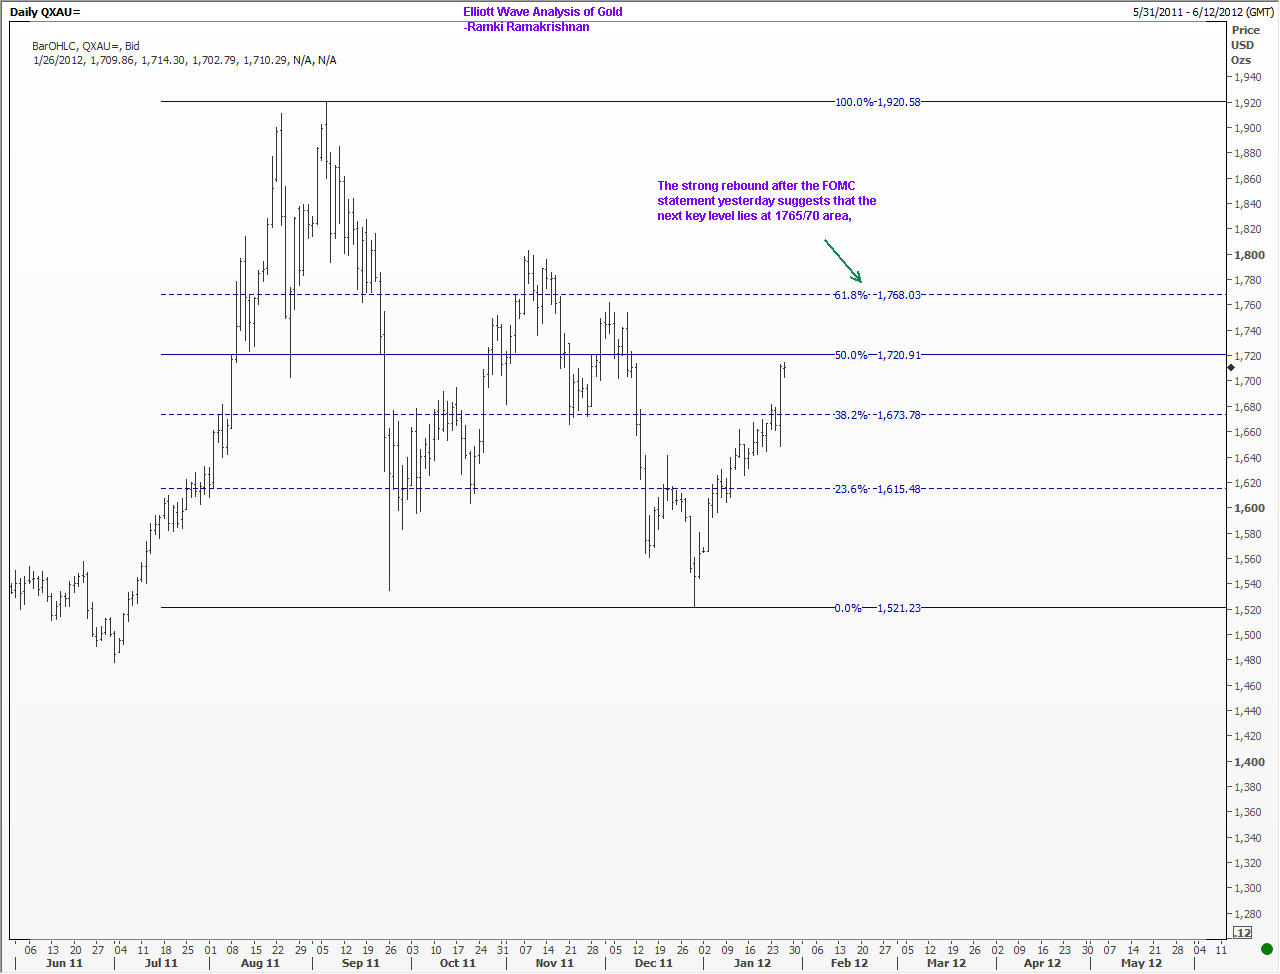
Yesterday I had posted a short term chart in Forbes suggesting a possible correction to 1625 area. However, from just below 1650 we saw a massive rally spurred by the FOMC statement. Of course, any shorts should have been stopped out at 1665 or close to that as recommended. WHere do we go now? Take a look at the following two charts. | |
If you'd like to see how I work through gold in real depth, I cover this in Module 15 (XAU/USD Gold).