
Technical analysis of Citigroup
15 April 2010
| |
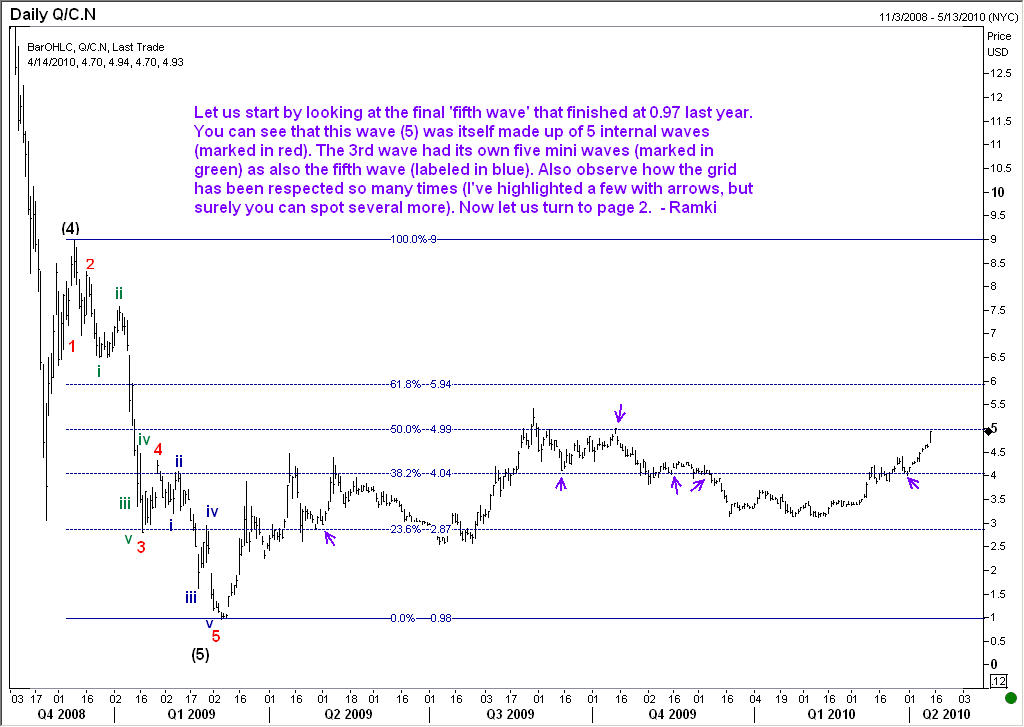
Citigroup has been moving up quite steadily this year. Has it got more room on the upside? I think so. Take a look at the two charts here. The first chart is to illustrate how the stock has respected the Elliott wave patterns very well on its way down. IN the second chart of Citigroup, you will see some more interesting details. Wave R was equal to wave P. If we assume that wave S will travel the same distance, then the target becomes 5.95. | |
Incidentally, that target will fall nicely at the resistance line too. However, if you are a fresh buyer, it may be a good idea to wait for a dip to perhaps 4.40 as shown in the chart. Good luck. Ramki | |
I teach exactly this kind of US stocks setup, step by step, in Module 6, Module 11, and several other modules of my course built around real US stock case studies.