
A closer look at Nasdaq chart
3 December 2008
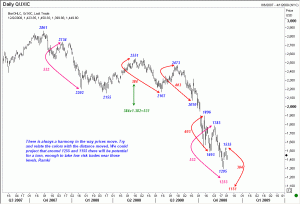
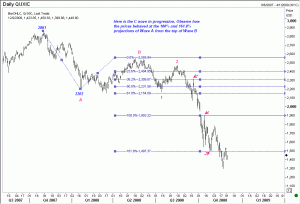
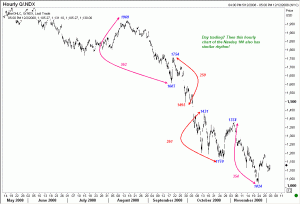
One of the fascinating things about financial markets is the underlying harmony in price action. Once you spot a trend developing, it is often useful to measure how far a move travelled, and be alert for a swing of similar distance in the next leg of the move. This works whether you are a medium term player, or a day trader. Take a look at the Nasdaq charts here, and you will see what I mean. | |
| |
| |
| |
Want to go further with the Nasdaq? Module 17 (Nasdaq Composite Index) walks through it with real trades and real numbers, not textbook theory.