
Dr.Reddy’s Laboratory in a bottoming formation
1 December 2008
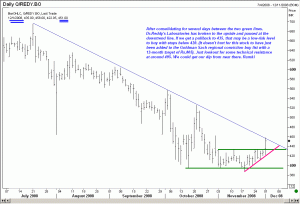
Every few days we will look at an emerging market stock. Dr. Reddy’s Laboratory has suddenly come to the limelight today. You will observe from the chart that this stock has been trading between two parallel lines for several days. Only once did it violate the lower line, but it closed higher. Now, we see that it has broken above the upper limit of the channel, and paused at the downtrend line. | |
Ideally, one would have preferred to see the volume to be significantly higher. Today’s volume of 67k is less than the 121k we saw last week when it moved down from Rs433 to 414. Yet, when a stock has just acquired institutional sponsorship (Goldman has added it to its conviction buy list), we should take notice. Allow for the trend line to break and for the stock to run into resistance at around Rs495. Then wait for a pull back to the breakout level and buy near there. Stops can be placed below the support line one can draw from its low at 387. Good luck! | |
| |
Want to go further with Indian stocks? Module 9, Module 10, Module 17 and Module 18 of my course, built around real Indian stock case studies like TCS, BHEL and Bajaj Finance walks through it with real trades and real numbers, not textbook theory.