
Elliott Wave Analysis of India’s NSEI
18 October 2011
| |
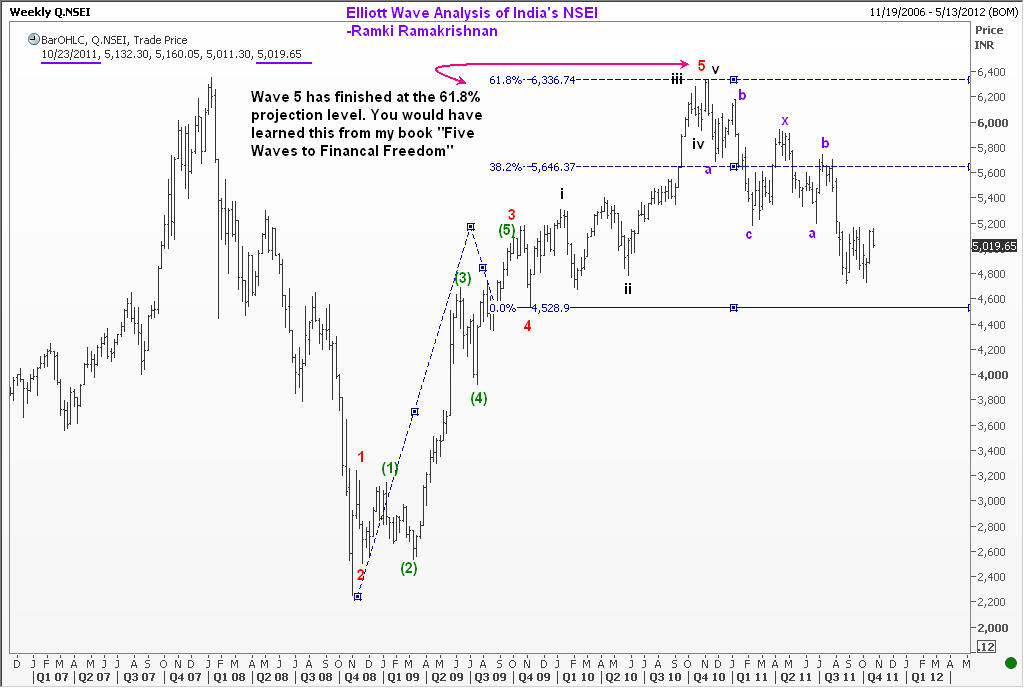
I have been receiving a steady stream of requests for an update on India’s main Stock Index. So I am presenting several charts that should guide readers in the near term. Please share with your friends and invite them to the club! | |
Elliott Wave Analysis of India’s NSEI suggests that there is room for one final leg down to around 4530 levels. Should we see that move, be prepared to buy near there because there is a reasonably good chance for a good sized recovery from there. | |
As always, the comments are brief, because the pictures speak more eloquently! Enjoy. | |
This is the kind of Indian markets setup I break down in detail in Module 9, Module 10, Module 17 and Module 18 of my course, built around real Indian stock case studies.