
Elliott Wave Analysis of Wockhardt Ltd
23 April 2014
In this post, I am going to present you with Elliott Wave analysis of Wockhardt Ltd. One of the members of my exclusive club had approached me for a consultation back in January 2014. It was the 14th of January, to be precise, and the stock was trading at Rs 413.65. The member sent me the following brief note: | |
“I consider myself as long term investor. I hope your advice/analysis will help in some of my long term investment decisions. By long term I mean I could hold for more than a year, if required. | |
Could you please look into the following stock for me: (I understand this will cost me 2 credits)Market – India – NSECompany – Wockhardt limitedSymbol – WOCKPHARMAExposure – None at this time. | |
Comment: This stock has comedown from around Rs. 2000 and currently trading at 420. It saw a low of 350 about 3 weeks back. Did it start its uptrend? Since the company is in pharma industry, it is subjected to lot of FDA regulations. I think FDA’s adverse observations made the stock to drop in recent times.” | |
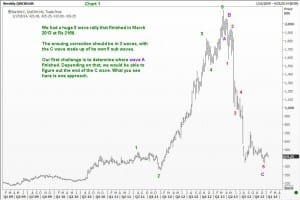
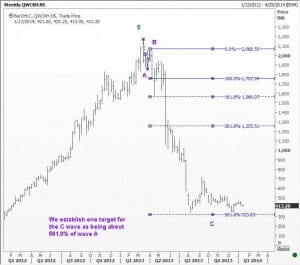
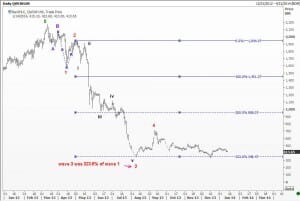
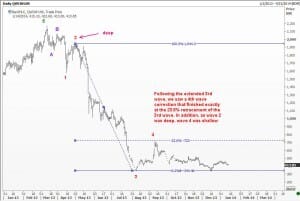
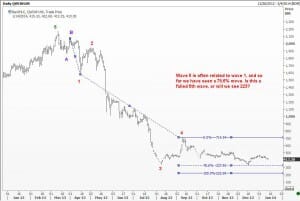
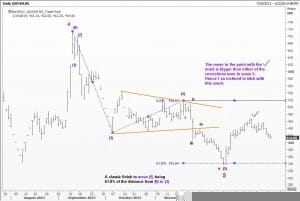
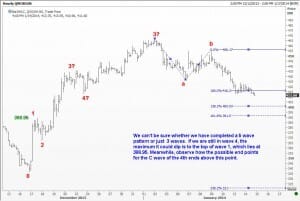
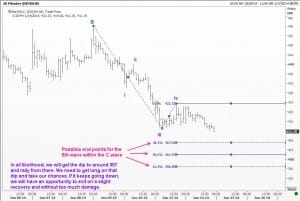
I looked at the chart, and could make out that it was going to be a challenge to come up with a sound analysis. I prepared a set of 10 charts and will share with you some of them here. Please note that this is not a marketing message. The idea is to allow readers to see the value of Elliott Wave analysis, and how someone with experience with Elliott Waves could come up with a sound strategy. I recommend that you open the charts in different tabs. | |
| |
| |
| |
| |
| |
| |
As can be seen from the above, I have finally come to the conclusion that a major correction is now over, and the rally that started off from that low is the first wave of a new cycle. Now comes the more interesting part, the one about where to buy. | |
| |
| |
So we have identified a low-risk entry point. However, there were other considerations like risk-management and what size to expose. Yet, an initial entry point has been identified. | |
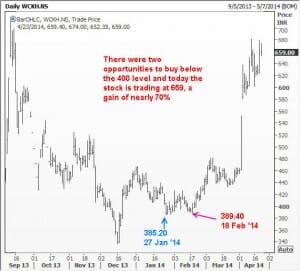
This member went long a decent position size at an average rate of 430. He probably purchased some on the way up after the dip, a smart investor I must say. He understood the size of the upcoming recovery, and wasn’t penny wise when it was the right time to take a risk. A majority of traders do the opposite. They take big risks when they should be cautious, and take small risks when everything points to a favorable move! Anyway, this is what happened. I am sharing with you just the plain chart without any notations. We got a dip down to below the 400 mark twice in the days that followed and the stock is up by nearly 70%. | |
| |
I teach exactly this kind of Indian markets setup, step by step, in Module 9, Module 10, Module 17 and Module 18 of my course, built around real Indian stock case studies.